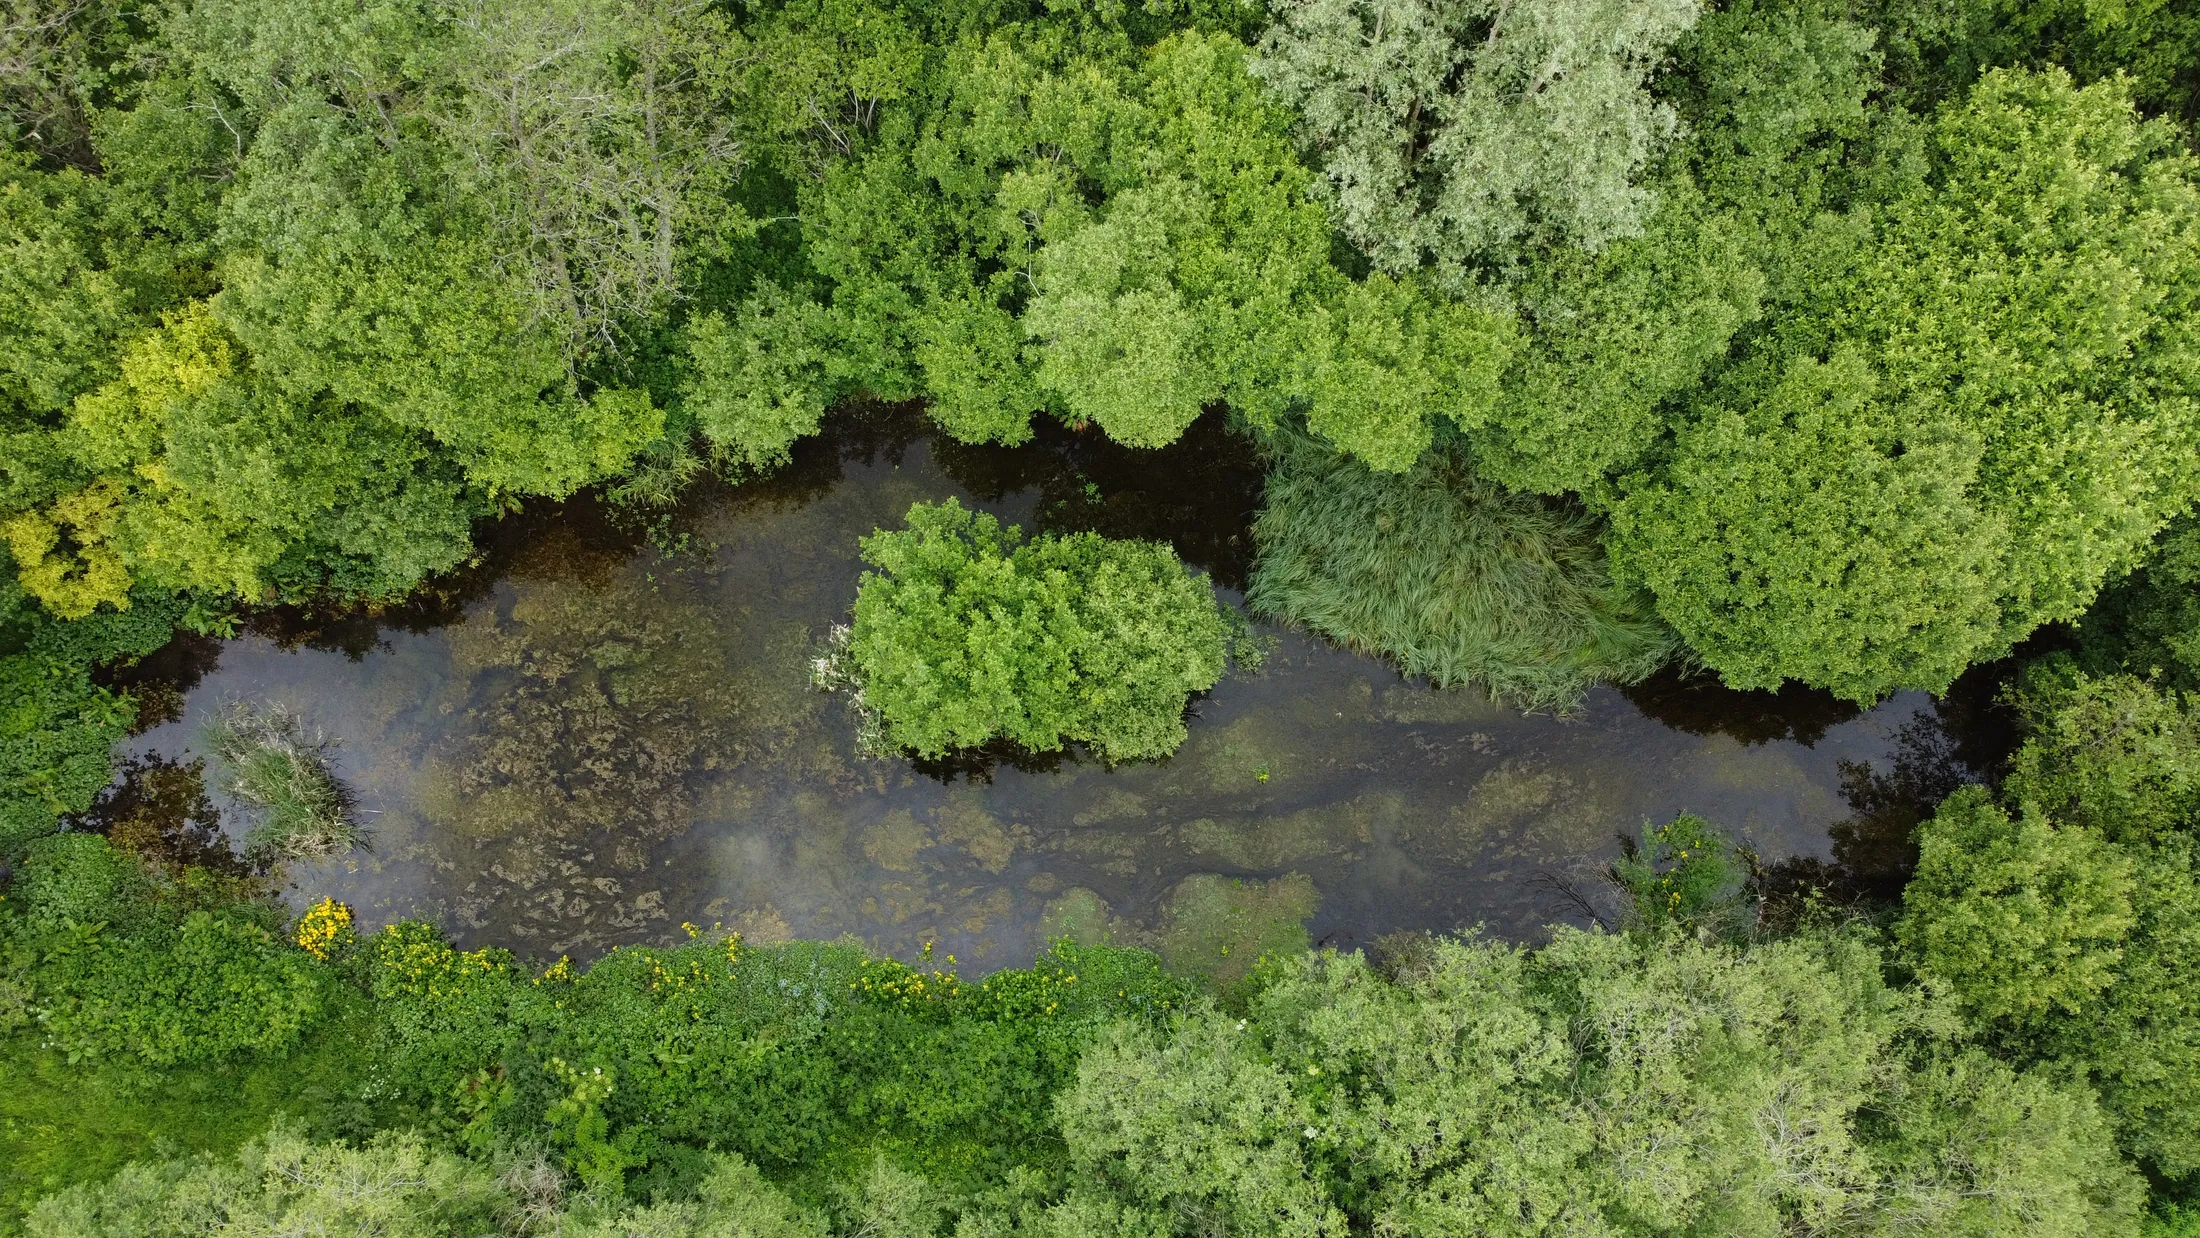
Aerial surveys / Industry
Individual tree detection and forest structure mapping
- Who it's for
- Foresters, estates, landowners and land managers
- Accuracy
- F1 score of about 0.94 in closed-canopy conifer
- Delivered as
- Files for QGIS or QField
How it works
- FlyOne LiDAR flight maps the treetops and the ground under them.
- DetectSoftware finds each tree and measures its height and crown.
- CheckWe test the results against trees measured by hand.
- DeliverThe tree map and models, as files for QGIS or QField.
- Keep trackIf you want it, a QField system for your team to log each tree.
What you get
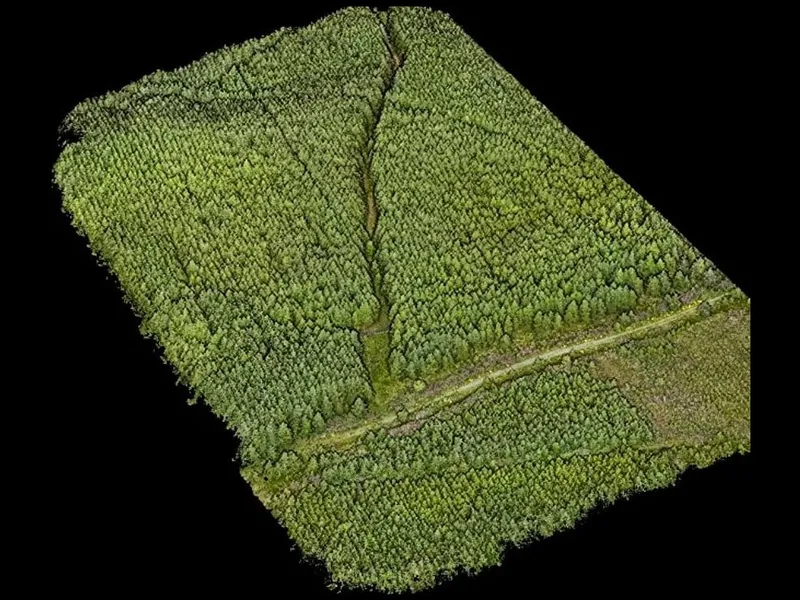 Point cloudMillions of measured points, from the treetops down to the ground.
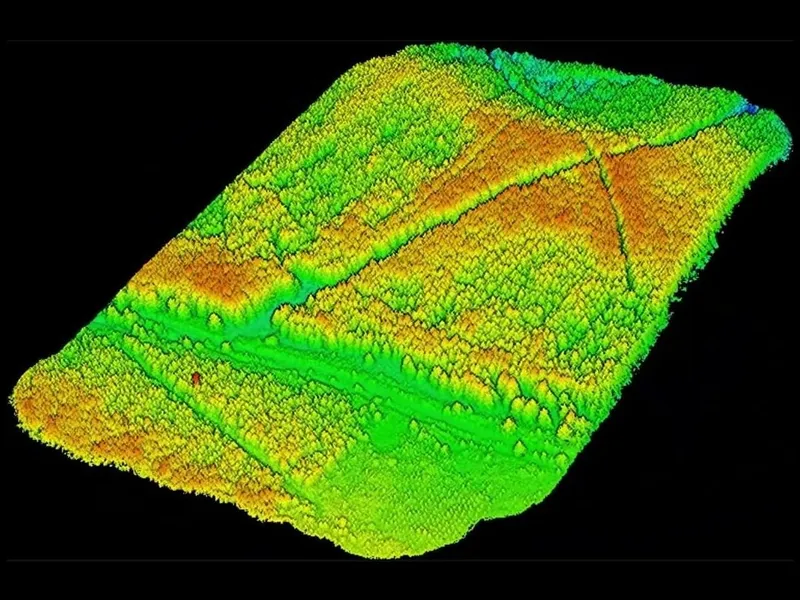 Canopy heightTree heights across the whole site.
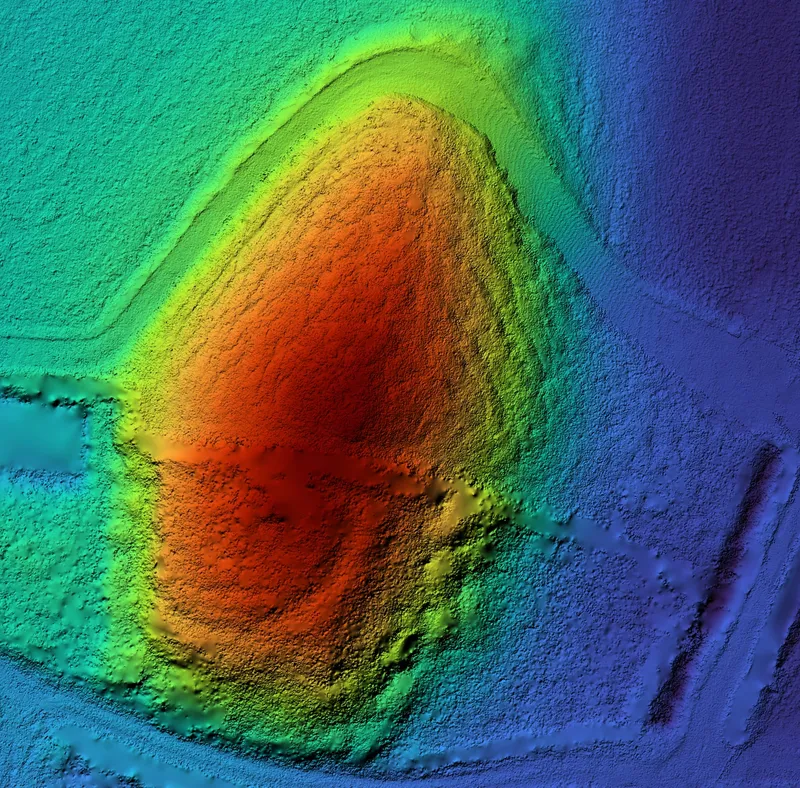 Ground under the treesA terrain model with the trees taken away.
- Tree mapEvery tree, with its position, height and crown size.
- Stocking and biomassTrees per hectare, and rough biomass estimates.
- Data quality noteWhere the data is strong, and where to treat it as a guide.
How accurate it is
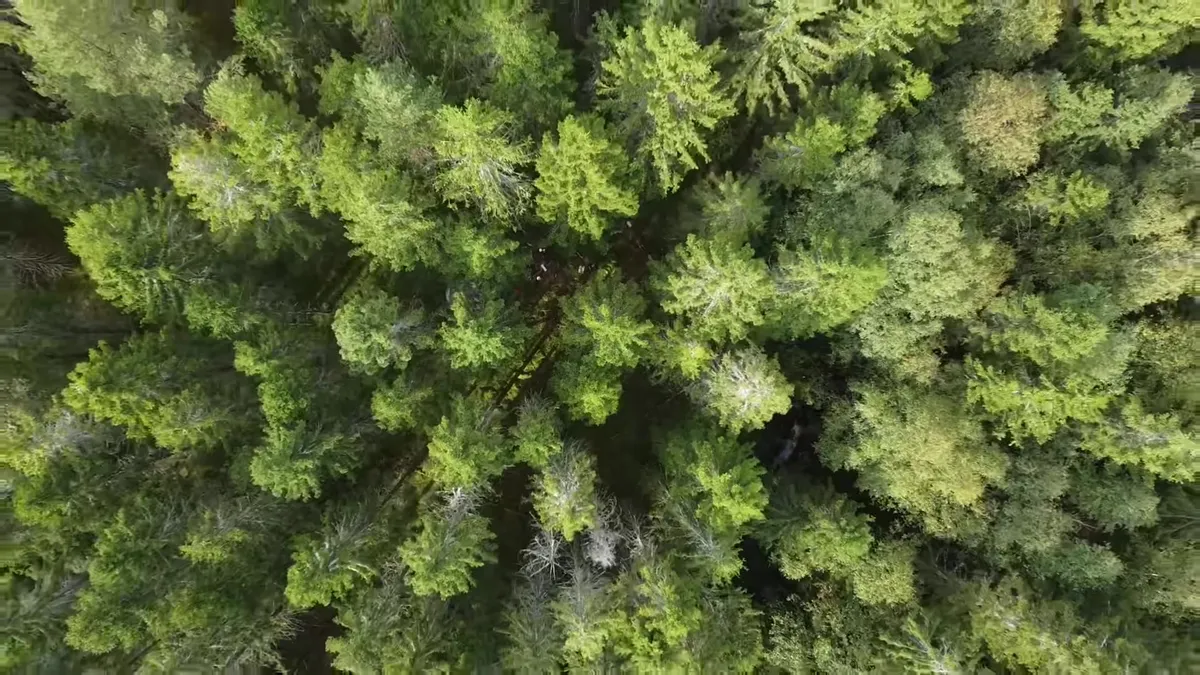
In closed-canopy conifer plantation the method scores an F1 of about 0.94. F1 is a standard score from 0 to 1 that counts both missed trees and false ones. We report it separately for each type of stand.
We developed the method on a conifer restock site in the Scottish Borders, and are extending it to broadleaf and mixed woodland.
Tree health
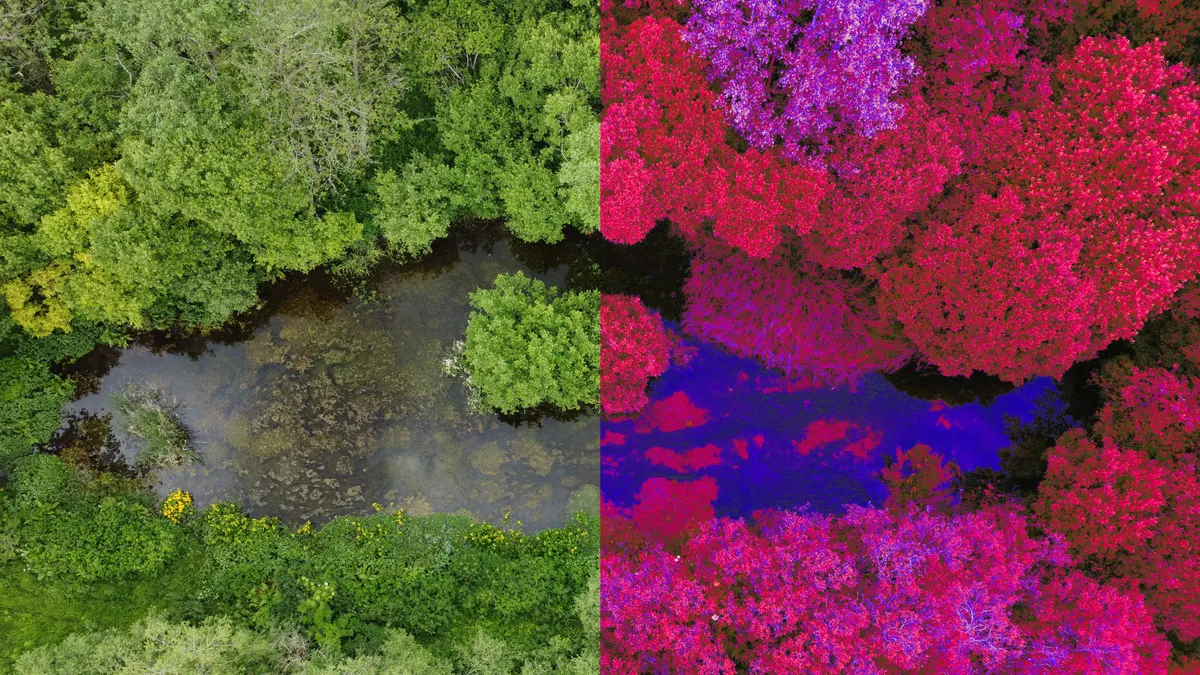
With multispectral imaging, the survey also shows tree health and stress you can't see by eye.
Invasive rhododendron
Multispectral imaging picks out rhododendron from the plants around it. LiDAR measures how tall and dense it is, and maps the slopes underneath.
For rhododendron clearance, you get
- Where it growsA map of the rhododendron across the site.
- How much there isA biomass estimate, area by area.
- How hard to clearA terrain map of slopes and access.
After the survey
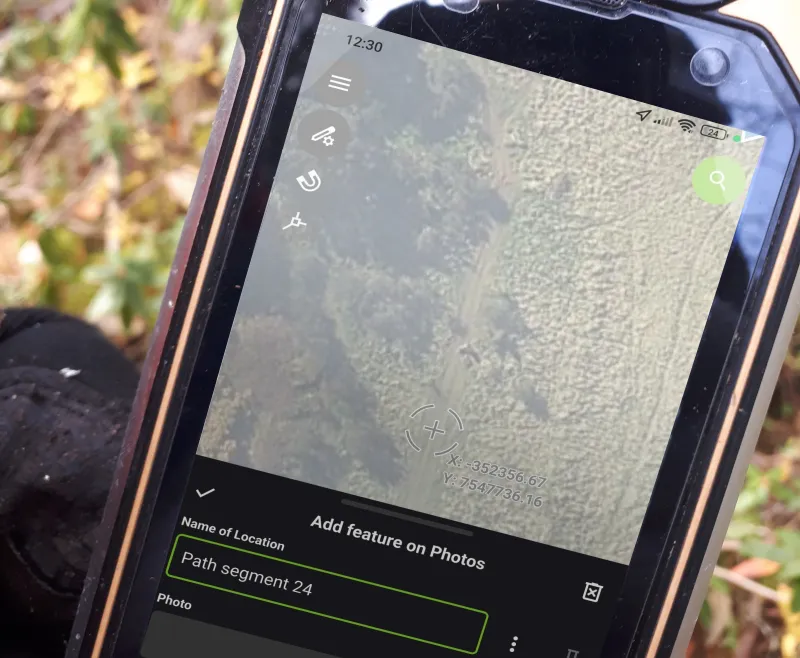
A survey shows the trees on one day. We can add a QField tree inspection system, so your team logs damage and work done against each tree on their phones. QGIS and QField are free, so there are no subscriptions.
See agriculture for water flow and plant health on farmland.
Ask for a quote: mail@geoklein.com