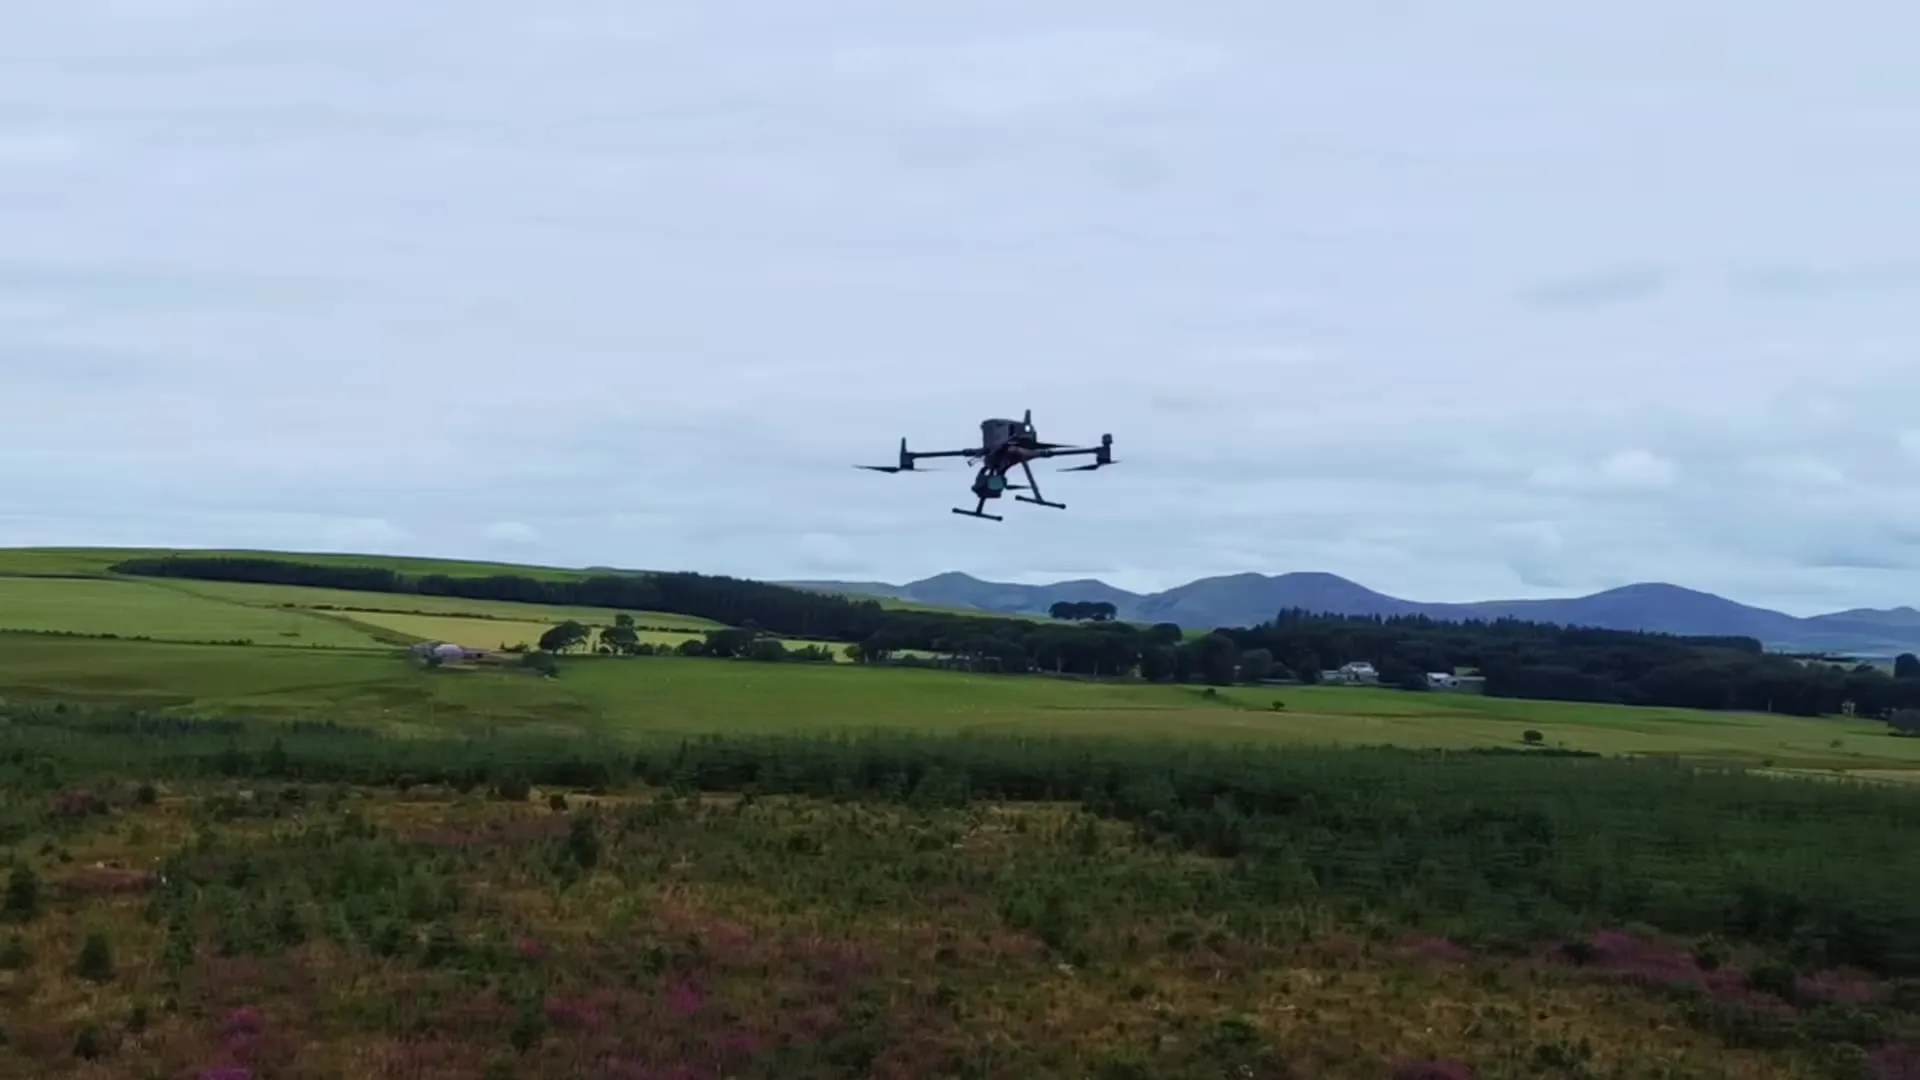
Aerial surveys / How we work
How we work
Most drone surveyors hand over data files. We also set up QGIS and QField around the data and train your team, so the survey gets used in the office and in the field.
Where a typical drone survey stops
Survey data often goes straight back out to the field. In forestry, for example, teams use the drone data to guide more measurements on the ground. Getting a pile of data files ready for the field can be tricky. We do that part for you.
What you get
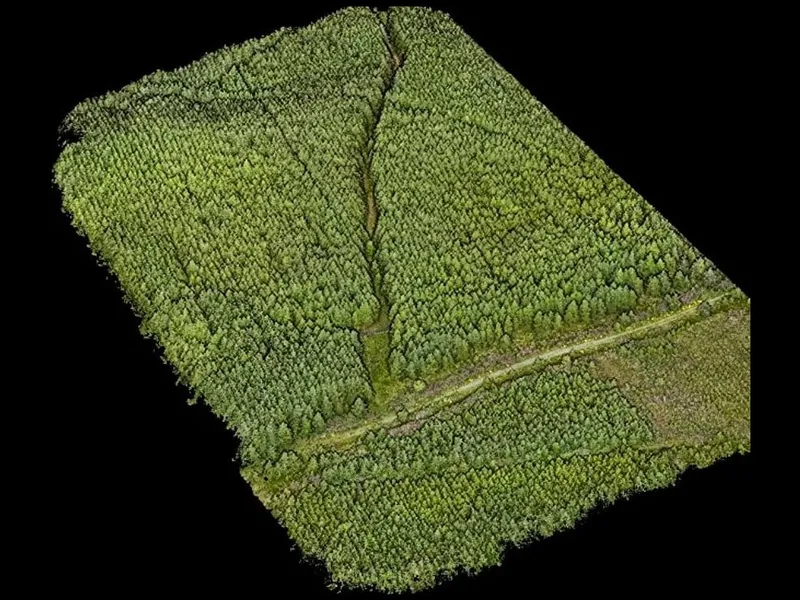 Survey dataPoint clouds, terrain models and orthomosaics.
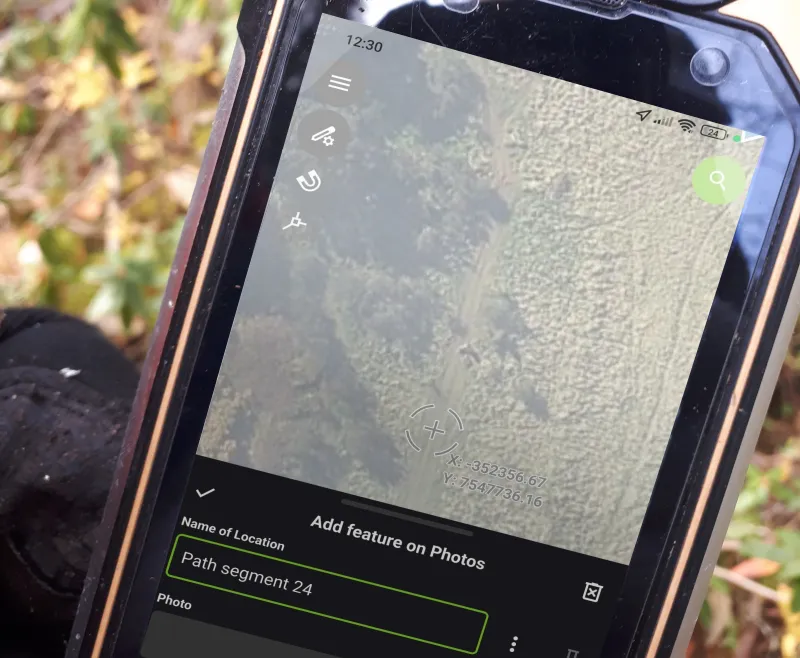 A working field setupYour survey in a QGIS project, and on your team’s phones with QField forms.
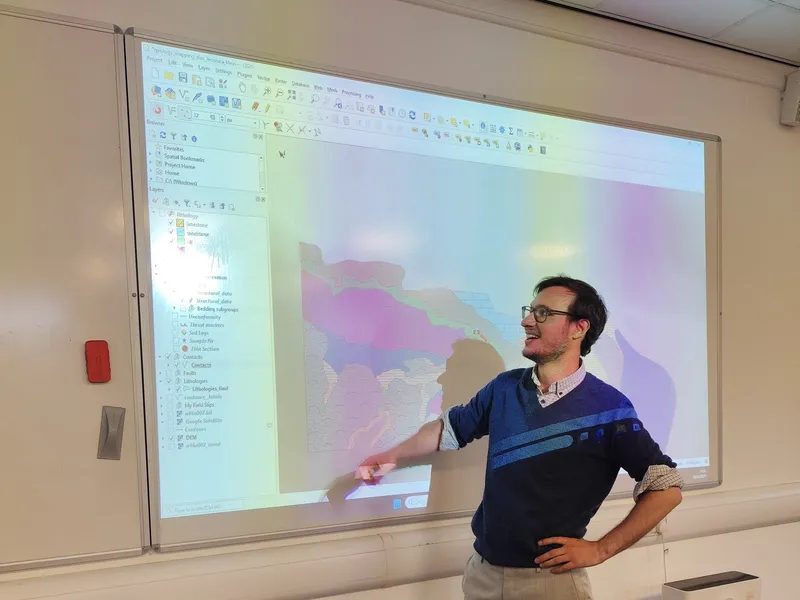 A trained teamYour team learns to run it themselves.
- Software licence fees: QGIS and QField are free
- £0
- QField works with no signal, then syncs back
- Offline
- Shared by the office and the field
- 1 project
How we survey
We choose the method for each job. Most of our work is LiDAR, often with photos taken on the same flight.
LiDAR
LiDAR fires laser pulses at the ground and times how long they take to bounce back. Some pulses slip through gaps in the leaves, so it maps the true ground even under thick trees, which a camera alone can't do.
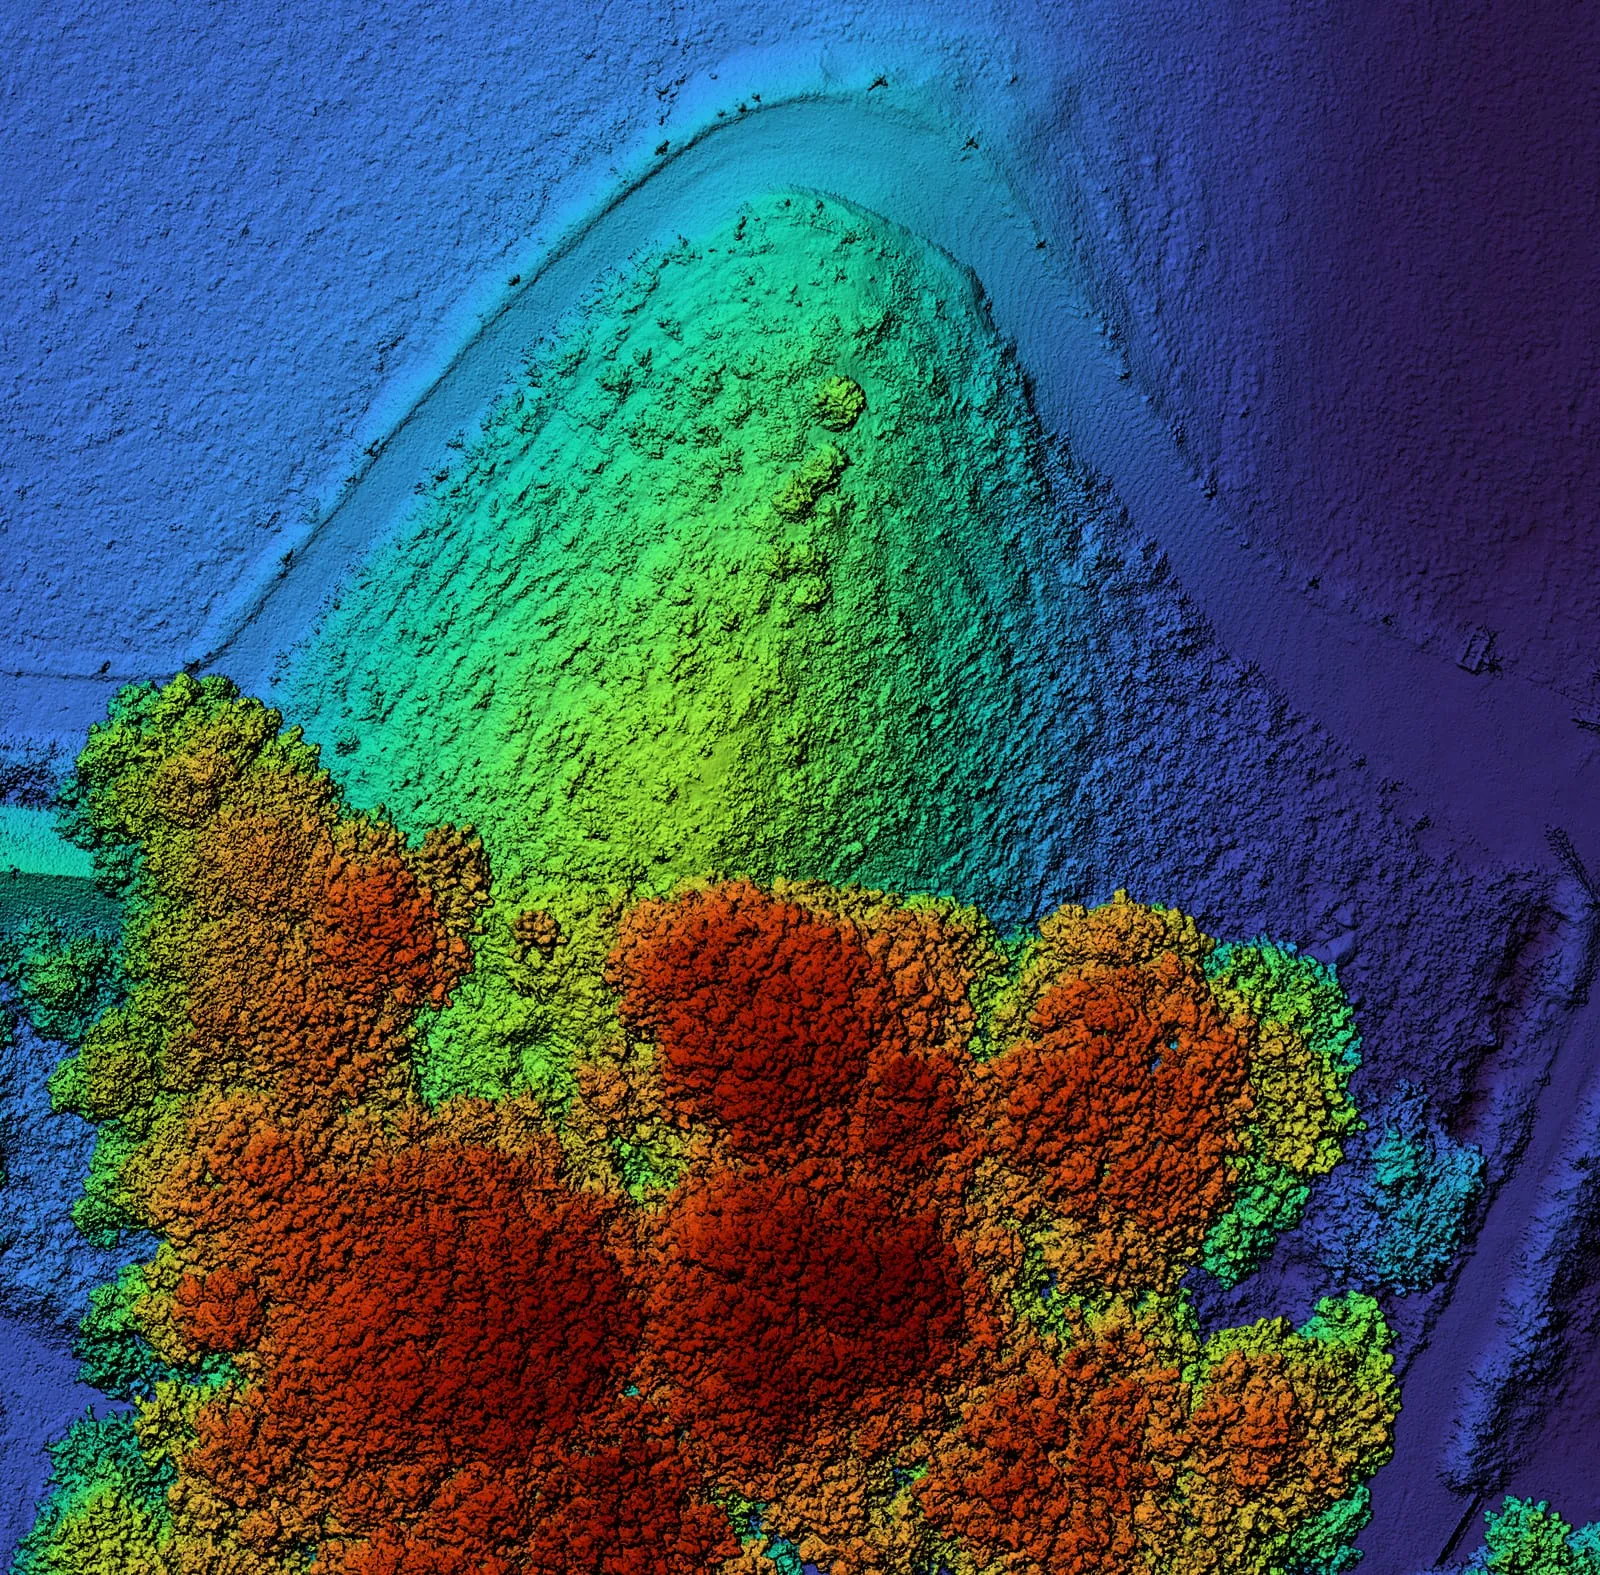
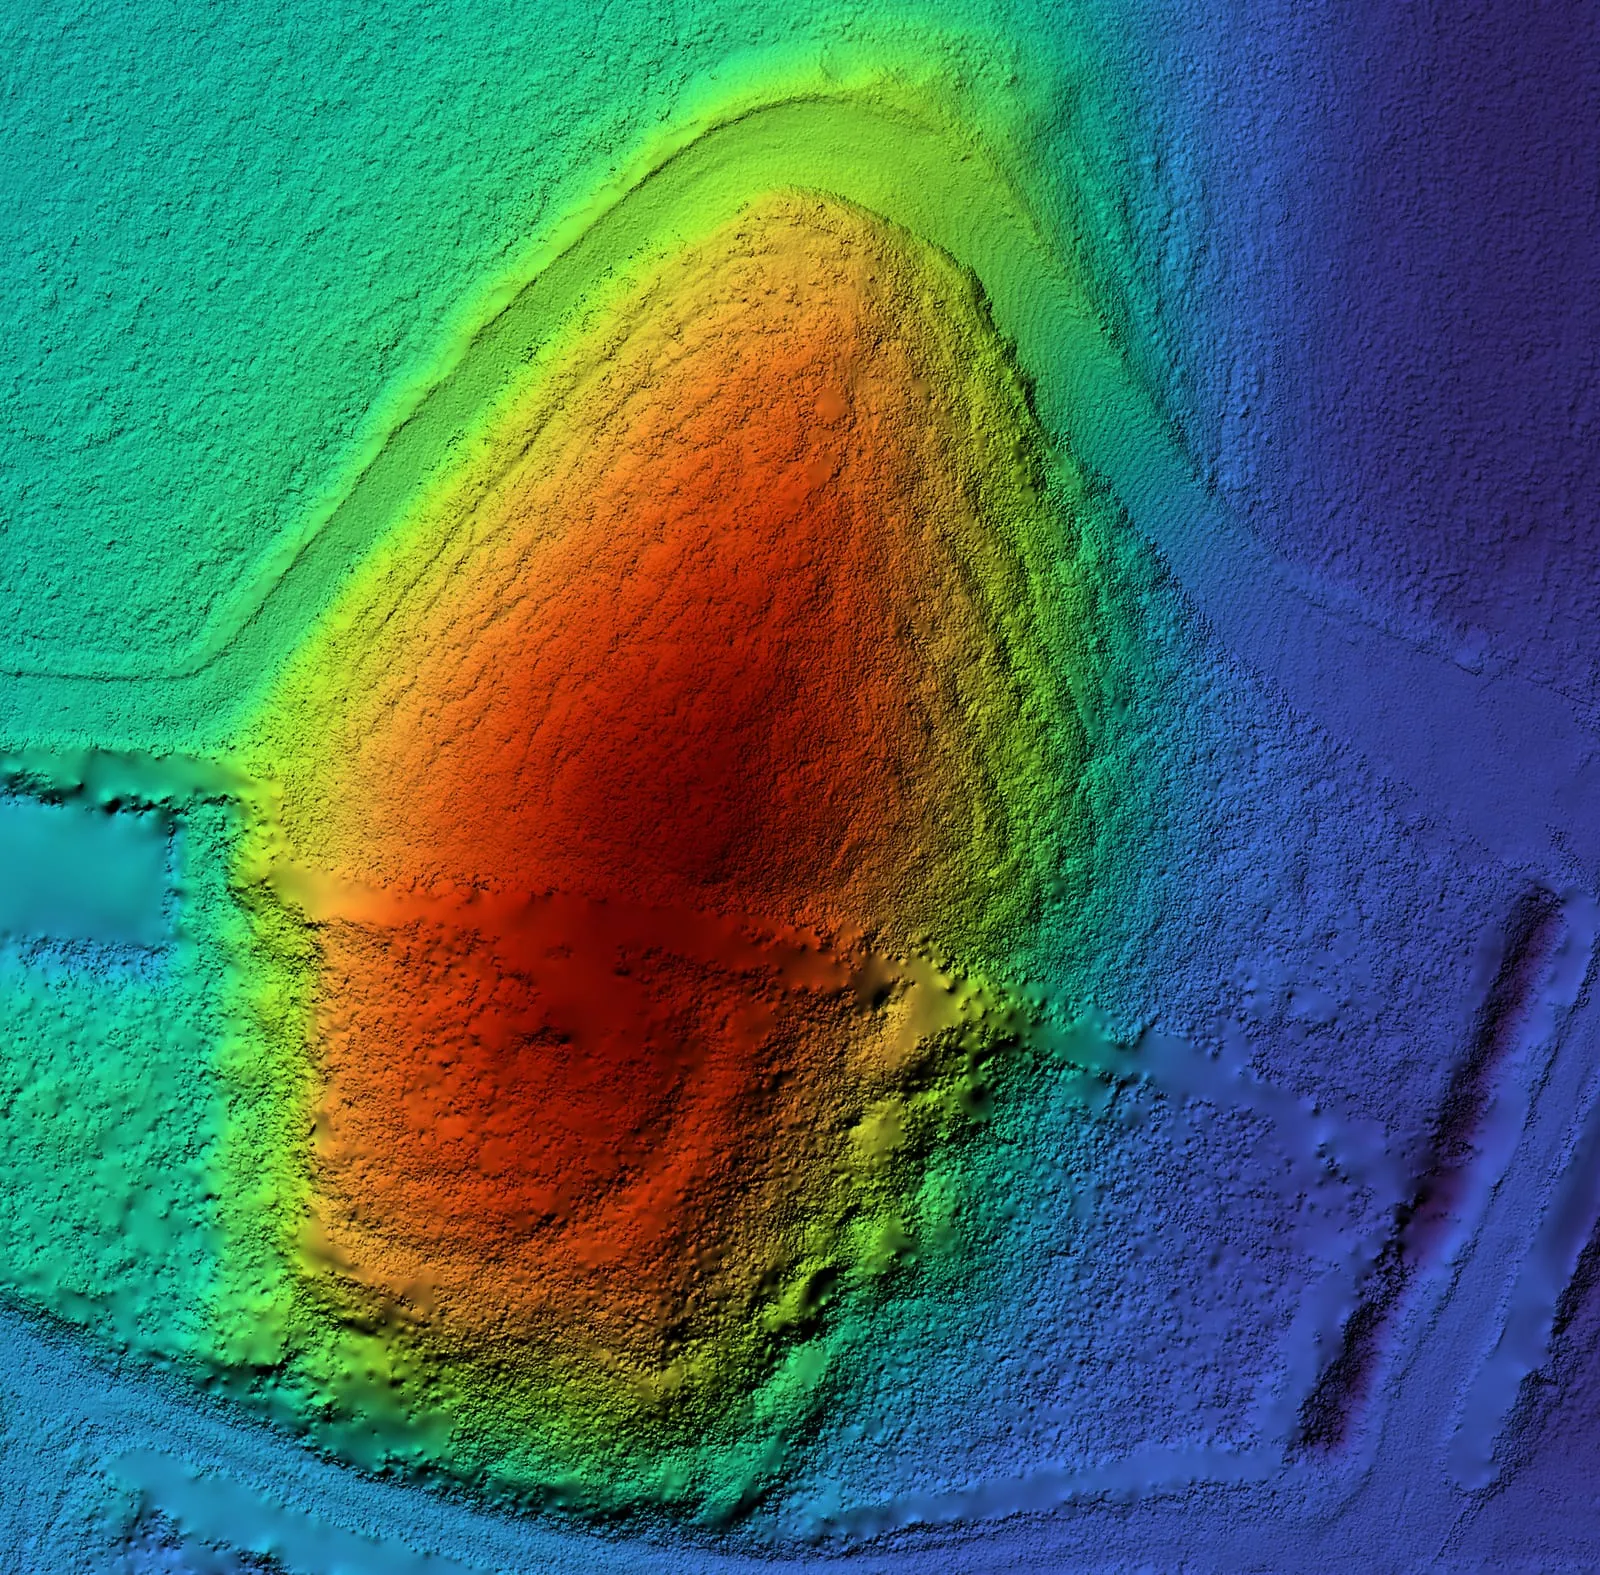
You get:
- A classified point cloud: millions of measured points in 3D
- Terrain and surface models
- Contours and cross-sections
- Volumes, for example cut and fill or stockpiles
We fly it with a DJI M350 RTK drone and a Zenmuse L2 sensor. There's more on our LiDAR page.
Photogrammetry
We take overlapping photos from the drone and stitch them into a flat aerial map (an orthomosaic) or a photorealistic 3D model. It's faster than LiDAR, and works best on open sites with simpler ground.
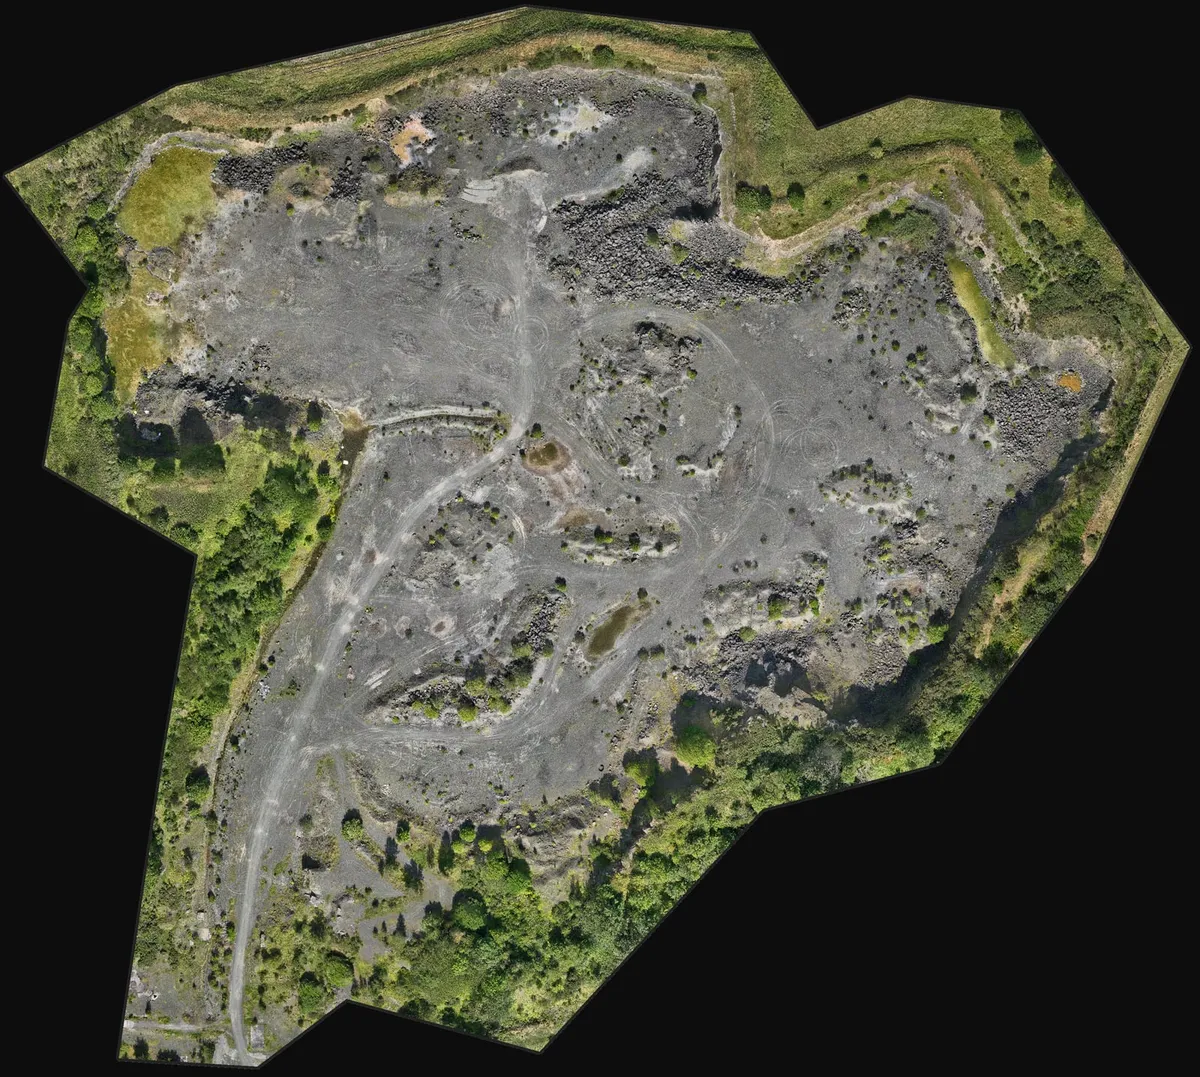
You get:
- Orthomosaic maps
- Elevation models
- Photorealistic 3D models, for example of cliffs and outcrops
- Construction progress, tracked survey to survey
We choose the camera for each job. The DJI Zenmuse P1, a 45 MP full-frame mapping camera on the M350 RTK, gives the sharpest maps. The DJI Matrice 4E maps large areas quickly. On LiDAR flights, the camera in the Zenmuse L2 takes the photos at the same time.
LiDAR or photogrammetry?
| LiDAR | Photogrammetry |
|---|---|
| Uncleared site with dense vegetation | Cleared site with sparse vegetation |
| Complex terrain | Photorealistic 3D models |
| Accurate ground models | Faster flight times |
| Most weather and lighting conditions | Map larger areas |
If you're not sure, tell us about the site and what you need, and we'll suggest one.
Multispectral
A multispectral camera sees light beyond what the eye can, including near-infrared. That shows plant health and stress before you can see it in an ordinary photo, using NDVI (a measure of how much red and near-infrared light a plant reflects).
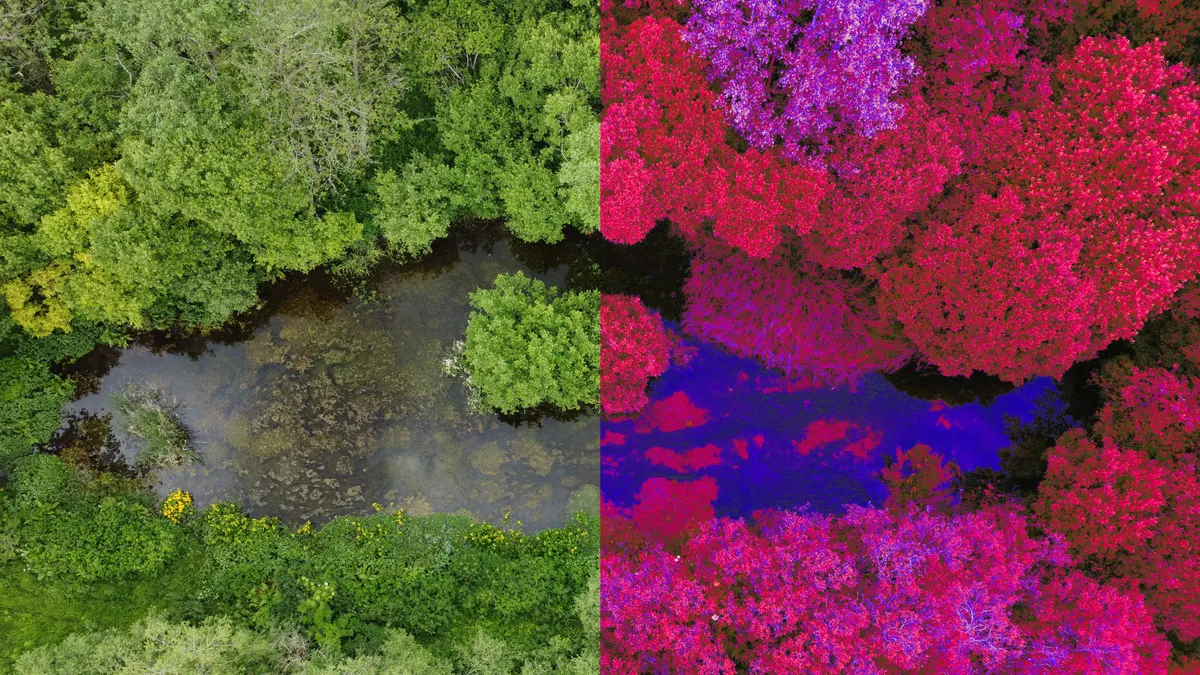
You get:
- NDVI and other plant health maps
- Habitat maps
- Crop and tree health images
We fly a DJI Mavic 3 Multispectral: a colour camera, four multispectral cameras (green, red, red edge and near-infrared), a sunlight sensor for consistent readings between flights, and RTK positioning to the centimetre. For research or detailed crop work, we can arrange a 10-band survey. For some jobs, ordinary colour photos are enough to give a useful plant health index, as on our vineyard project.
Thermal
A thermal camera measures heat instead of light. From the air it shows temperature differences across a whole site, which makes faults and warm animals easy to find.
Solar farms
A faulty solar panel runs hotter than the panels around it. A thermal survey picks out hot spots, failed cells, faulty bypass diodes and strings that have stopped producing. Each fault is mapped to its panel, so the maintenance team can walk straight to it. It is much quicker than checking panels on foot.
For a solar farm, you get:
- A map of every fault, located to the panel
- A thermal image and a colour photo of each fault
- A list of faults, most serious first
Other heat mapping
Thermal maps can also show wet ground, springs and seepage, and heat escaping from buildings.
Deer and wildlife counts
We count deer and other wildlife on estates, in forests and on hill ground, and map where the animals are. Counts are carried out with a colleague who specialises in deer. Flying covers ground that is hard to walk, and disturbs the animals less than a count on foot.
Partner sensors
Some jobs need a sensor we don't fly ourselves. For these we bring in a partner we trust, and combine their results with our own survey data:
- Ground-penetrating radar (GPR): finding buried services, voids and archaeology.
- Magnetometry: finding buried metal and unexploded ordnance, and mapping geology.
- Bathymetry: mapping lake and river beds with drone-mounted sonar.
- Methane detection: finding gas leaks.
Questions
What file formats?
Point clouds as LAS or LAZ, orthomosaics and terrain models as GeoTIFF, and vector data such as contours as Shapefile or GeoPackage. The exact list is agreed per job.
How accurate is it?
LiDAR ground heights are usually accurate to better than 5 cm. On one of our quarry surveys, the ground model's absolute accuracy was 2.6 cm (RMSE), checked against GNSS-surveyed ground markers. That meets RICS Band E for ground levels.
How long does it take?
We aim to deliver the data and report within 1 to 2 weeks. Bigger jobs can take longer, and we'll confirm the date with your quote.
Are you insured?
Yes. We hold £1 million public and product liability insurance for commercial drone work, anywhere in the UK, the EU, Norway and Switzerland. We can send you the certificate. Professional indemnity insurance is available on request.
What about permissions and CAA rules?
We are a registered CAA drone operator, and our pilot holds the CAA General Visual Line of Sight Certificate (GVC). We also hold a CAA operational authorisation (PDRA01), which allows flights in built-up areas under conditions set by the CAA.
Ask for a quote: mail@geoklein.com